Bubble Plots
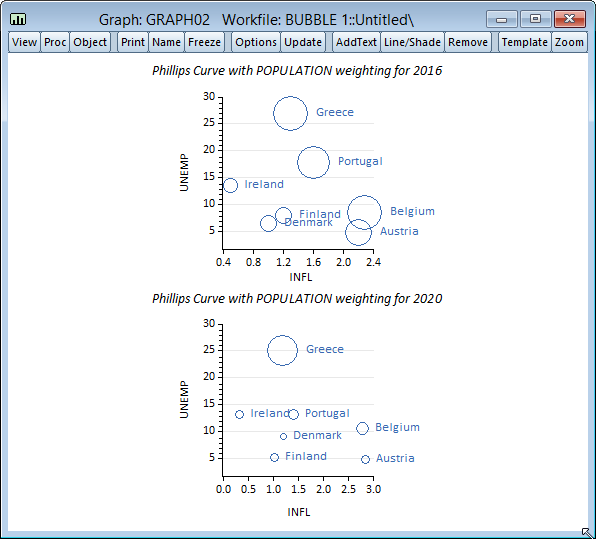
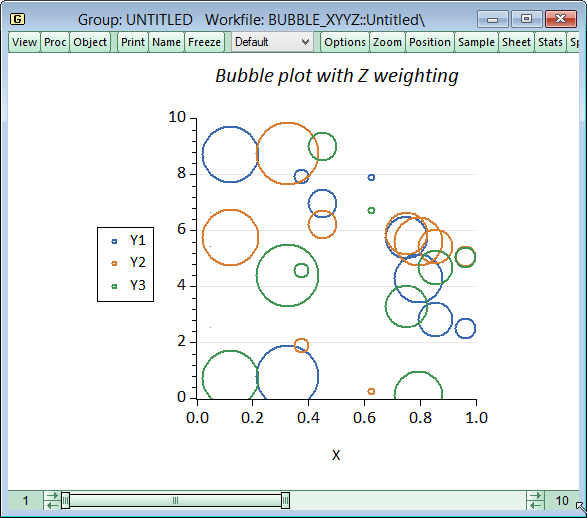
EViews 10 introduces bubble plots as a new graph type. Bubble plots are extensions of scatter plots, where a third dimension may be used to specify the size of the data points. Unlike traditional scatter plots, where bubble sizes are fixed, bubble plots allow for variable size bubbles
Observation labels can be added to annotate each bubble.