GOALS
In this tutorial we examine another sampling technique, importance sampling. Today we will
- Write a GAUSS procedure for evaluating a univariate t-density at a specified point.
- Write a GAUSS procedure for getting a random draw from the t(n) distribution.
- Calculate the posterior mean and standard deviation of θ using importance sampling with an importance function of t(0,1,v).
- Calculate the mean and standard deviation of the importance function.
INTRODUCTION
Importance sampling is a Bayesian estimation technique which estimates a parameter by drawing from a specified importance function rather than a posterior distribution.
Importance sampling is useful when the area we are interested in may lie in a region that has a small probability of occurrence. In these cases, other sampling techniques may fail to even draw from that area.
Importance sampling overcomes this issue by sampling from a distribution which weights the region of interest.
Importance sampling:
- Allows us to solve problems that may not be feasible using other sampling methods.
- Can be used to study one distribution using samples generated from another distribution.
- Examples include Bayesian inference, rare event simulation in finance or insurance, and high energy physics.
The Importance Sampler Steps
There are several steps to implementing the importance sampling algorithm.
- Set up sampler specifications including the number of iterations, the parameters of the importance function, and initialize all importance sums to zero.
- Draw θ from the importance function.
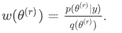
- Calculate the importance sampling weight
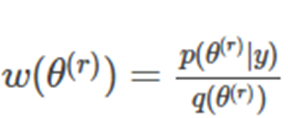 and the weight squared.
 - Repeat 2-4 for the desired number of iterations.
- Final calculations of parameters.
THE IMPORTANCE FUNCTION
Today will will use the t-distribution to calculate the importance weights for our sampler. The t-distribution is bell-shaped like the normal distribution but has heavier tails. We will need to be able to do two things with our distribution, draw random variables from it and evaluate the p.d.f at a point.
Random Variables From the T-Distribution
Random variables drawn from a t-distribution can be calculated using the normal distribution and the chi-squared distribution. A random variable drawn from the t-distribution is given by![]()
where Z is a standard normal random variable with zero mean and variance 1 and V is a chi-squared random variable with v degrees of freedom.
Evaluating the T-Distribution at a Point
We can evaluate a t-distribution at a point using the probability distribution function. The p.d.f for a general t-distribution, t(μ,∑,v), with mean μ, scale matrix ∑, and v degrees-of-freedom is given by![]() where
where![]()
Procedure to draw from the t-distribution
The first step towards implementing the importance sampler is to build a procedure that will draw randomly from the t(0,1,v) distribution.
 proc (number_returns) = procedure_name(argument_list);
 local variable_1, variable_2, ...., variable_k;

. . .
 . . .
 retp(return_list);
 endp;
Note: Procedures are user-defined functions that allow you to organize and easily reuse multiple lines of commands in a compact manner. A GAUSS procedure definition must always begin with the proc statement and end with the endp statement.
We can build the procedure using the GAUSS rndn and rndChiSquare procedures.
 // Define procedure to draw t-distributed random numbers
 proc (1) = rndTDist(n, df);
 // Local variables used only inside procedure
 local z, x, t;

// Draw from standard normal distribution
 z = rndn(n, 1);

// Draw from the chi-squared distribution
 x = rndChiSquare(n, 1, df);

// Compute the t-distribution RV
 t = (z*sqrt(df))./sqrt(x);

retp(t);
 endp;
Procedure to evaluate the t-distribution at a point
To simplify our computation we will first log transform the p.d.f. We can then transform our results using the exponential function.
Using k = 1 and taking the log of ct
![]()
Taking the log of the density we find![]()
ln. Use log10 to compute the log10.// Define a procedure to compute the t PDF proc (1) = tDensity(apoint, a_mean, acapv, adof); local ln_constant, dens; /* ** Evaluate univariate t density with ** arguments amean, acapv and adof ** at apoint */ ln_constant =.5*ln(acapv) + .5*ln(pi) + lnfact(.5*adof - 1) - lnfact(.5*(adof + 1) - 1) - .5*adof*ln(adof); dens = -.5*(adof + 1)*ln(adof + ((apoint - a_mean)^2)/acapv) - ln_constant; retp(exp(dens)); endp;
Note: The lnfact command can be used to find log(Γ(θ)) using the fact that log(Γ(θ)) = Infact (θ – 1).
Once we have written these procedures we can call these functions the same as we would any GAUSS function. For example, we can draw a 2×1 vector of values from a standard t-distribution with 2 degrees of freedom
 // Set random number seed for repeatable random numbers
 rndseed 34532;

t = rndTDist(2, 2);
 print "Random draws from the t-distribution"
 t;
Random draws from the t-distribution
 -0.0378
 -2.0359
SET IMPORTANCE SAMPLER PARAMETERS
With our t-distributions written we are now ready to implement our sampler. The first step is to set up sampler specifications. We need to:
- Specify the number of iterations.
- Specify the parameters of the importance function.
 // Number of iterations
 keep_draws = 10000;

// Mean of importance function
 mean_is = 0;

// Scale factor of importance function
 scale_is = 1;

// Degrees of freedom of importance function
 dof_is = 2;
PRE-INITIALIZE VECTORS TO HOLD THE DRAWS
Next, we need to initialize the storage matrices for our parameters. We will a running sum of θ, θ², w(θ(r) and w(θ(r))². We will start each of these sums at 0.
 // Start all importance sampling sums at zero
 theta_mean_is = 0;
 th2mo_is = 0;
 wsum = 0;
 wsum2 = 0;
© 2024 Aptech Systems, Inc. All rights reserved.
Run sampler using for loop
Within our for loop, we will combine our Monte Carlo integration and importance sampler. At each iteration of the importance sampler, we will
- Make a current draw from the t(μ,∑,v) distribution.
- Compute the importance weight using
- Add the current importance sampler draw to the sum of all importance sampler draws.
- Add the square of the current importance sampler draw to the sum of all squares of the importance sampler draws.
- Add the current importance weight draw to the sum of all importance weights.
- Add the square of the current importance weight to the sum of the square of all importance weights.
 for i(1, keep_draws, 1);

/*
 ** Importance sampling draw.
 ** Current importance sampler draw from t-distribution
 */
 theta_draw = mean_is + sqrt(scale_is)*rndTDist(1, dof_is);

// Calculate importance weight
 w = pdfn(theta_draw)/tDensity(theta_draw, mean_is, scale_is, dof_is);

// Weighted sum of the importance sampler draws
 theta_mean_is = theta_mean_is + w*theta_draw;

// Weighted sum of the square of the importance sampler draws
 th2mo_is = th2mo_is + w*theta_draw^2;

// Find sum of weights
 wsum = wsum + w;

// Find sum of squared weights
 wsum2 = wsum2 + w^2;

endfor;
COMPUTE SAMPLE STATISTICS
Finally, we will find the sample averages to estimate our parameters of interest.
 // Importance sampler draws
 // Mean
 theta_mean_is = theta_mean_is / wsum;

// Standard deviation
 th2mo_is = th2mo_is / wsum;
 thsd_is = sqrt(th2mo_is - theta_mean_is^2);

print "Importance Sampling Posterior Mean and Standard Deviation";
 theta_mean_is thsd_is;

// Importance sampler weights
 // Mean
 wmean = wsum / keep_draws;

// Standard deviation
 wstd = sqrt(wsum2/keep_draws - wmean^2);

print "Mean and standard deviation of importance sampling weights";
 print wmean wstd;
The code above will produce the following output.
Importance Sampling Posterior Mean and Standard Deviation
  0.011509244     0.98248437
Mean and standard deviation of importance sampling weights
  1.0034724       0.38012744
CONCLUSION
Congratulations! You have:
- Written a GAUSS procedure for evaluating a univariate t-density at a specified point.
- Written a GAUSS procedure for getting a random draw from the t(n) distribution.
- Calculated the posterior mean and standard deviation of θ using importance sampling with an importance function of t(0,1,v).
- Calculated the mean and standard deviation of the importance function.
The next tutorial introduces the Gibbs sampler.
For your convenience, the entire code is below.
 // Define procedure to draw t-distributed random numbers
 proc (1) = rndTDist(n, df);
 // Local variables used only inside procedure
 local z, x, t;

// Draw from standard normal distribution
 z = rndn(n, 1);

// Draw from the chi-squared distribution
 x = rndChiSquare(n, 1, df);

// Compute the t-distribution RV
 t = (z*sqrt(df))./sqrt(x);

retp(t);
 endp;

// Define a procedure to compute the t PDF
 proc (1) = tDensity(apoint, a_mean, acapv, adof);

local ln_constant, dens;
 /*
 ** Evaluate univariate t density with
 ** arguments amean, acapv and adof
 ** at apoint
 */
 ln_constant =.5*ln(acapv) + .5*ln(pi) + lnfact(.5*adof - 1) - lnfact(.5*(adof + 1) - 1) - .5*adof*ln(adof);
 dens = -.5*(adof + 1)*ln(adof + ((apoint - a_mean)^2)/acapv) - ln_constant;

retp(exp(dens));
 endp;

rndseed 34532;

// Number of iterations
 keep_draws = 10000;

// Mean of importance function
 mean_is = 0;

// Scale factor of importance function
 scale_is = 1;

// Degrees of freedom of importance function
 dof_is = 2;

// Start all importance sampling sums at zero
 theta_mean_is = 0;
 th2mo_is = 0;
 wsum = 0;
 wsum2 = 0;

for i(1, keep_draws, 1);

/*
 ** Importance sampling draw.
 ** Current importance sampler draw from t-distribution
 */
 theta_draw = mean_is + sqrt(scale_is)*rndTDist(1, dof_is);

// Calculate importance weight
 w = pdfn(theta_draw)/tDensity(theta_draw, mean_is, scale_is, dof_is);

// Weighted sum of the importance sampler draws
 theta_mean_is = theta_mean_is + w*theta_draw;

// Weighted sum of the square of the importance sampler draws
 th2mo_is = th2mo_is + w*theta_draw^2;

// Find sum of weights
 wsum = wsum + w;

// Find sum of squared weights
 wsum2 = wsum2 + w^2;

endfor;

// Importance sampler draws
 // Mean
 theta_mean_is = theta_mean_is / wsum;

// Standard deviation
 th2mo_is = th2mo_is / wsum;
 thsd_is = sqrt(th2mo_is - theta_mean_is^2);

print "Importance Sampling Posterior Mean and Standard Deviation";
 theta_mean_is thsd_is;

// Importance sampler weights
 // Mean
 wmean = wsum / keep_draws;

// Standard deviation
 wstd = sqrt(wsum2/keep_draws - wmean^2);

print "Mean and standard deviation of importance sampling weights";
 print wmean wstd;
Note: The tDensity and pdfTDist procedures are based upon code by James LeSage, University of Toledo.