Do you ever:
Forget the name of the function that gives you the tail of the chi-squared distribution?
Have trouble remembering how to reference a coefficient value in an expression, a test, or a linear combination?
Have trouble accessing the mean or standard deviation after summarize?
Need to know the maximum value that will fit in a byte variable?
Want to see all the operators available in Stata expressions?
Forget the order of arguments to the combinatorial function?
Need to access today’s date? Or the current time?
Create some macros in your session and forget what they are named?
I sometimes do.
What do I do?
I call up a nearly secret tool that will make child’s play out of all these problems. You can interactively browse and then use in your analysis almost anything you have created or estimated, or anything that Stata knows: estimated coefficients or other estimation results, mathematical constants, function names and arguments, variables, system limits, local and global macros, dataset and variable notes, and more.
Where is this magic tool?
Right where you need it.
Go to the Data menu and select Create or change data, and then select Create new variable.
After estimation, go to the Statistics menu and select Postestimation, and then select Linear combinations of estimates or Nonlinear combinations of estimates. Or, select Postestimation > Tests > Test linear hypotheses.
Or, for that matter, select Data > Other utilities > Hand calculator.
All these selections (and others) present a dialog box that allows you to enter an expression. Beside the entry field for the expression is a button labeled Create. Click on that button. What lies beneath is a veritable smorgasbord of delightful things that are otherwise fiddly to recall and use.
Here is the Expression builder when it opens:
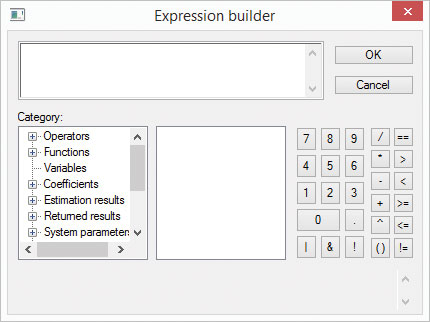
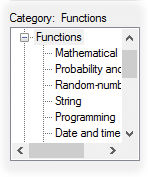
There is a field for typing an expression at the top and a rather useless keypad along the right for entering numbers and operators—easier to just type them on your keyboard. The real fun lies in that tree view of categories along the left. Click on the little plus sign (triangle on Mac and Linux) beside Functions, and you see a list of categories for functions.
Click on Probability and density, scroll down to chi2tail(), and click on it.
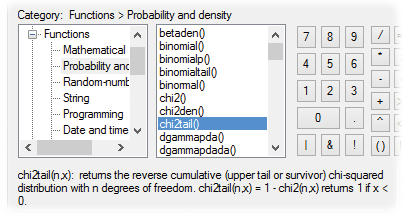
Below the two boxes, we see a description of the chi2tail() function with a description of its arguments. We have answered our first question.
What’s more, we easily see our way to the sixth question. Click on Mathematical in the left pane and then comb() in the right pane. The description at the bottom makes clear the order of the two arguments required to compute the combinatorial function.
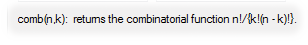
If we wanted to use the combinatorial function to generate a new variable, we could just double-click on comb(), and it would be inserted into the edit field of the Expression builder with n and k ready for us to substitute values or variables for the “n choose k” problem.
If you’re not much for using dialog boxes to do your work, that’s fine, neither are we. (Kevin and I like things reproducible.) Just use the dialog to bring up an Expression builder so you can browse, and then use what you have learned by browsing to type in your Command Window or do-file.
What about accessing coefficients or even standard errors from your latest estimation? You’ll certainly need these if you want to perform a linear or nonlinear test involving coefficients. Or, if you want to use coefficients to form a linear or nonlinear expression.
Let’s run a regression of cooling degree days on average January and July temperatures and on indicators for regions of the country (U.S.).
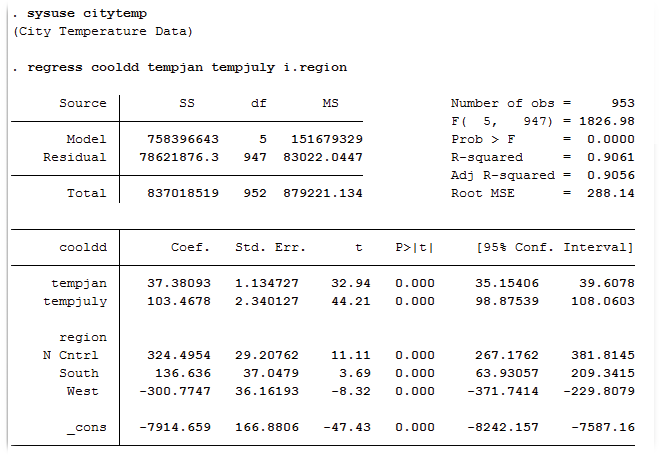
Cooling degree days are just a unitless measure of the annual amount of energy required to cool a building. Those of you in England (or Sweden) may find heating degree days more compelling.
How do we reference those coefficient estimates? Especially those tricky factor-variable levels for region that have been so conveniently shown as labels on our output. Return to the Expression builder, and click on the plus sign beside Coefficients. The right panel now shows a nice list of all the coefficients from my model.
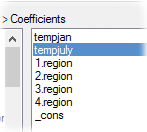
Clicking on tempjuly shows the following note at the bottom:
_b[tempjuly] = 103.46782
Clicking on 3.region shows
_b[3.region] = 136.63604
We see how to reference both the coefficient _b[3.region] and its estimated value 136.63604. If we were using a test, a testnl, a lincom, or an nlcom dialog box, we could double-click on any variable to insert that reference into my expression. If we were using the Expression builder to explore, we would know to type _b[3.region] to use the coefficient on the indicator of the third level of region in my expression.
Multiequation estimators reference coefficients with names like _b[yvar:mycoef], which are even trickier to recall.
By the way, the rest of the interesting values from my regression are also available. Click on the plus sign by Estimation results and then click on Scalars.
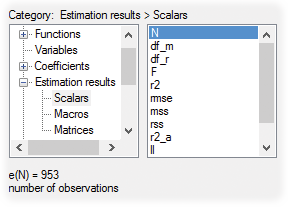
We can access the number of observations, the model and residual degrees of freedom, the F statistic, the R-squared, and other values.
We have essentially answered question 3. The results from summarize are available just like those from regress. They are found under Returned results rather than Estimation results.
How about that largest value that will fit in a Stata byte-type variable? (Question 4.) Expand System parameters and click on Numerical and string limits. Selecting maxbyte will show you that the maximum value is 100 and that you can reference it by typing c(maxbyte).
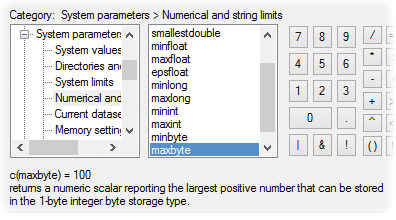
Lots of other limits are in this same list. We also see lists for system values (where we will find the current date and time, and the answer to question 7); system limits; and information on directories and paths, the current dataset, memory, graphics settings, and much more. It’s worth browsing these some time just to see all the things that Stata gives you access to in your expressions and programs.
Question 5 may seem mundane, but perhaps you have been away from Stata for some months and coding in FORTRAN, where the greater-than-or-equal operator is .GE.. Yes, you must include those dots. We leave answering the question to you. Hint: Look at the top of the Category list.
Likewise, the answer to finding your local and global macros (question 8) is left as an exercise. Hint: Look toward the bottom of the list.
It’s hard to get a sense of how easy this is from a written description. Luckily, our colleague Chuck Huber has created a video showing such tricks “live”. So, you can watch him put the Expression builder through its paces.
That’s a lot of utility for a tool that measures only 400 by 300 pixels on your screen. Give it a try the next time you need to use a half-forgotten function or access some of your results.