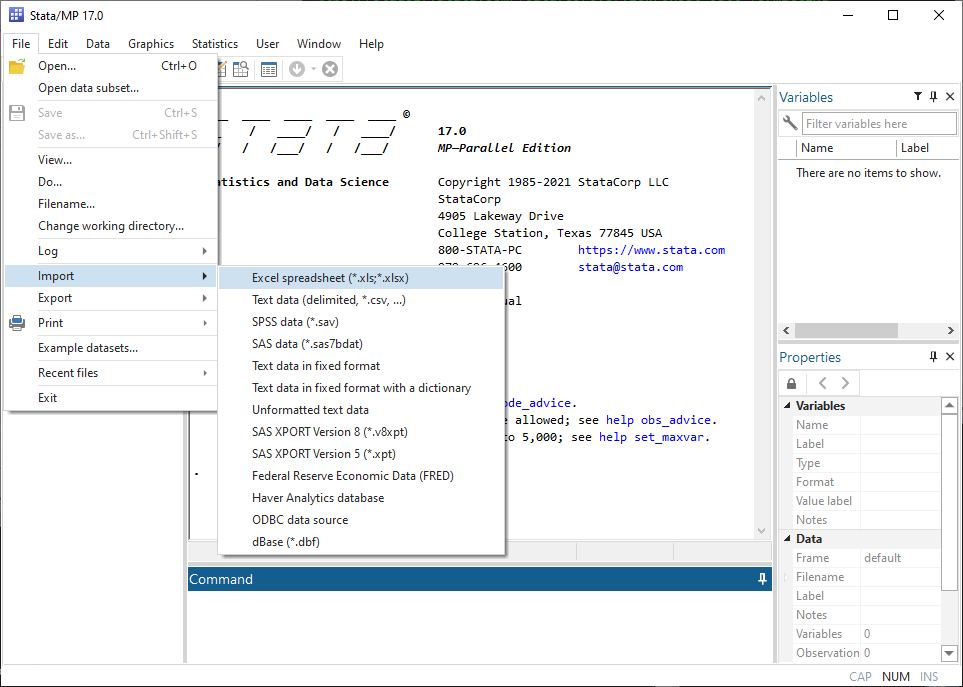
Stata for Windows, Mac, and Linux can directly import data and export data and results to Microsoft Excel files. Both Excel 1997/2003 (.xls) files and Excel 2007/2010/2013 (.xlsx) files are supported.
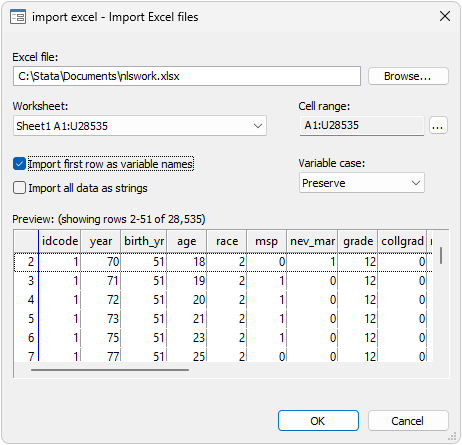
Above you see the preview tool, which you can use to see the data in an Excel worksheet before importing it and adjust options controlling how the data are imported.
import excel features
.xls and .xlsx support
import any worksheet from a workbook with multiple worksheets
import a custom cell range
treat first row of Excel data as Stata variable names
automatic conversion of Excel dates to Stata dates
automatic optimization of Stata storage types
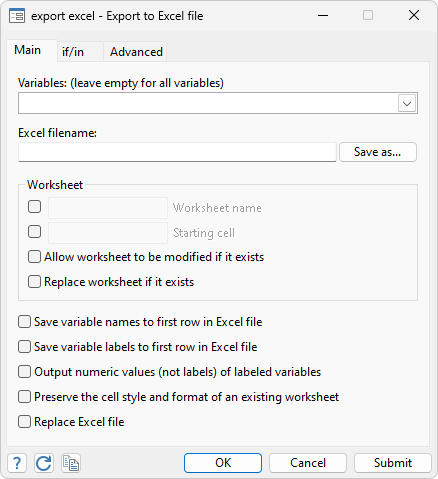
export excel features
.xls and .xlsx support
replace an entire workbook
add a worksheet to an existing workbook
replace a single worksheet within an existing workbook
modify a subset of cells within an existing worksheet
save Stata variable names or variable labels to first row of worksheet
automatic conversion of Stata dates to Excel dates
export value labels or the underlying values
specify a custom missing-value code to use in worksheet
putexcel features
.xls and .xlsx support
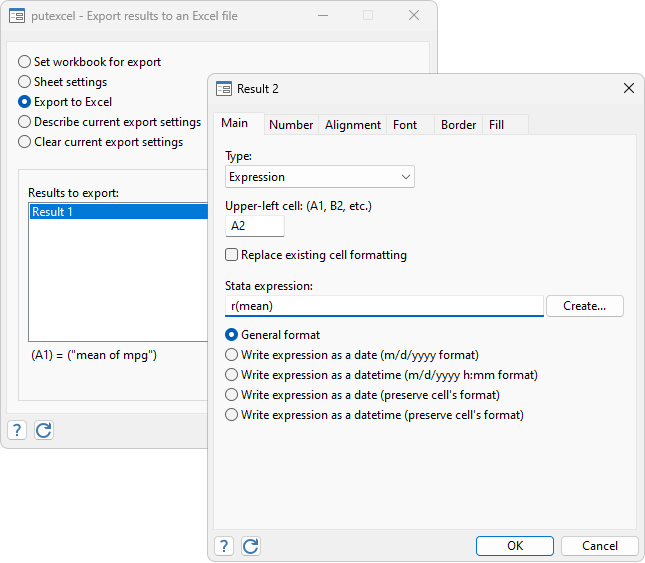
export Stata returned results to a worksheet
export a Stata matrix in memory to a worksheet
export a custom numeric or string expression
insert a Stata graph or any PNG, JPEG, WMF, or TIFF file to a worksheet
create cell formulas in a worksheet
format cells in a worksheet
number formats
cell border style and color
horizontal and vertical alignment
fill patterns and foreground/background color
font formatting
font, font size, font color
bold, italic, strikeout, underline
subscrips
text wrapping, text indent, text rotation
replace an entire workbook
add a worksheet to an existing workbook
replace a single worksheet within an existing workbook
modify a subset of cells within an existing worksheet
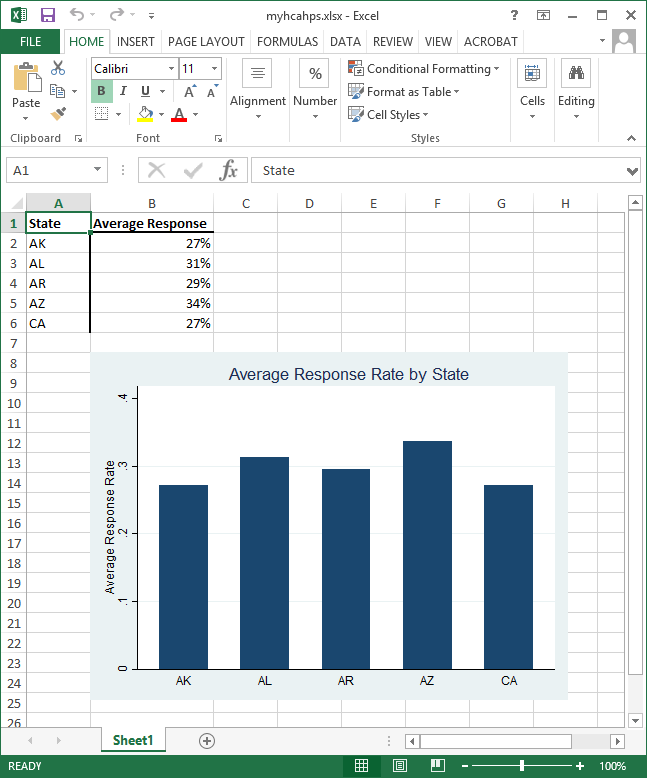
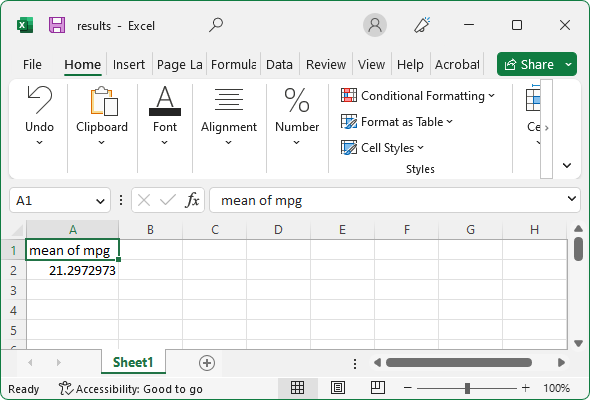
produces this
And if we have the following Excel worksheet,
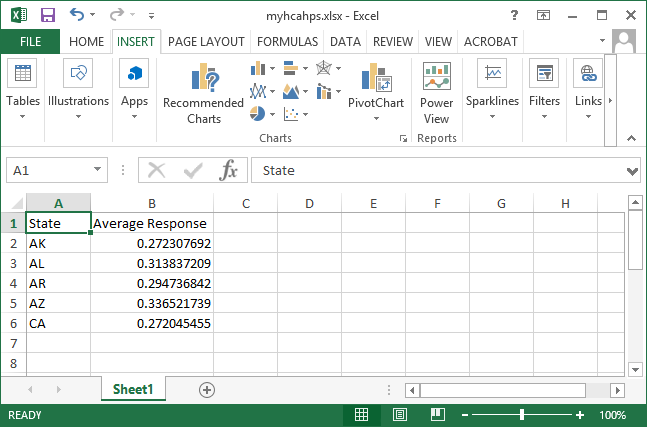
we can bold the column titles with the command
. putexcel (A1:B1)=bold("on") using myhcahps.xlsx, modify
add a solid black border below the column titles and on the right side of the State column with the commands
. putexcel (A1:B1)=border("bottom", "medium", "black") using myhcahps.xlsx, modify


. putexcel (A1:A6)=border("right", "medium", "black") using myhcahps.xlsx, modify
format the Average Response column as a percent:
. putexcel (B2:B6)=nformat("percent") using myhcahps.xlsx, modify
and insert a Stata bar graph, bar1.png, into the worksheet:
. putexcel (B8)=picture("bar1.png") using myhcahps.xlsx, modify
The result is