
@RISK, the revolutionary software system for the analysis of business and technical situations impacted by risk! The techniques of risk analysis have long been recognized as powerful tools to help decision makers successfully manage situations subject to uncertainty. Their use has been limited because they have been expensive, cumbersome to use, and computationally intensive. However, the growing use of computers in business and science has offered the promise that these techniques can be commonly available to all decision makers.
What are the chances of making money–or taking a loss–on your next venture? How about the probabilities of staying within budget or needing a contingency? Armed with that information, you could take the guesswork out of big decisions and plan strategies with confidence. With @RISK, you can answer these questions and more–right in your Excel spreadsheet. @RISK is the flagship of Palisade’s analytics solutions, performing risk analysis using Monte Carlo simulation. It computes and tracks many different possible future scenarios, and shows you the probability of each occurring. @RISK’s analytics guide your decision-making process to achieve the optimal outcome.
Everyone would like answers to these types of questions. Armed with that kind of information, you could take a lot of guesswork out of big decisions and plan strategies with confidence. With @RISK®, you can answer these questions and more – right in your Excel spreadsheet.
@RISK (pronounced “at risk”) software is an add-in tool for Microsoft Excel that helps you make better decisions through risk modeling and analysis. It does this using a technique known as Monte Carlo simulation. @RISK’s Monte Carlo analysis computes and tracks many different possible future scenarios in your risk model, and shows you the probability of each occurring. In this way, @RISK shows you virtually all possible outcomes for any situation. This probabilistic approach makes @RISK a powerful tool that you can use to judge which risks to take and which ones to avoid—critical insight in today’s uncertain world.
Wouldn’t you like to know the best allocation of your limited resources to maximize your profits? Or the most efficient schedule to minimize costs? But what about the uncertainty inherent in sales projections, returns from individual investments, or production costs? Traditional optimization methods ignore this uncertainty, a very risky approach. RISKOptimizer tells you not only the best combination of inputs to use, but the risk associated with each strategy. It does this by combining optimization algorithms with Monte Carlo simulation. You can seek out strategies that enable you to minimize your risks while achieving your goals.
| INDUSTRY | SAMPLE APPLICATION |
| FINANCE AND SECURITIES | Retirement planning, Currency valuation, Real options analysis, Discounted Cash Flow analysis, Value-at-risk, Portfolio optimization |
| INSURANCE / REINSURANCE | Loss reserves estimation, Premium pricing |
| OIL / GAS / ENERGY | Exploration and production, Oil reserves estimation, Capital project estimation, Pricing, Regulation compliance |
| MANUFACTURING | Six Sigma and quality analysis, New product analysis, Production siting, Plant shutdown, Product life cycle analysis |
| PHARMACEUTICALS / MEDICAL / HEALTHCARE | New product analysis, R&D estimation, Disease infection estimation |
| ENVIRONMENT | Endangered species preservation, Pollution cleanup and projections |
| GOVERNMENT AND DEFENSE | Resource allocation, War games, Welfare and budgetary projections |
| AEROSPACE AND TRANSPORTATION | Cost estimating, Highway planning and optimization, Supply chain distribution |
How @RISK Works
Running an analysis with @RISK involves three simple steps:
| 1. Set Up Your Model.
Start by replacing uncertain values in your spreadsheet with @RISK probability distribution functions, like Normal, Uniform, or over 50 others. These @RISK functions simply represent a range of different possible values that a cell could take instead of limiting it to just one case. Choose your distribution from a graphical gallery, or define distributions using historical data for a given input. Even combine distributions with @RISK’s Compound function. Share specific distribution functions with others using the @RISK Library, or swap out @RISK functions for colleagues who don’t have @RISK.
Next, select your outputs—the “bottom line” cells whose values interest you. This could be potential profits, ROI, insurance claims payout, disease recovery rate, or anything at all.
Define Uncertainty with Ease
Input distributions may be correlated with one another, individually or in a time series. Correlations are quickly defined in matrices that pop up over Excel, and a Correlated Time Series can be added in a single click. A Correlated Time Series is created from a multi-period range that contains a set of similar distributions in each time period.
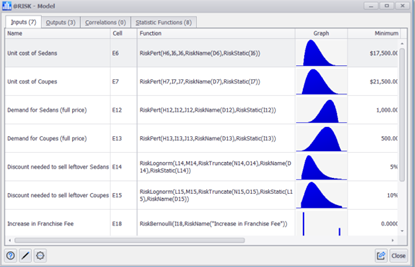
All @RISK functions and correlations in your model are summarized—with thumbnail graphs—in the dashboard-style @RISK Model window, and you can watch distribution graphs pop up as you browse through cells in your spreadsheet.
Share Your Model with Others |
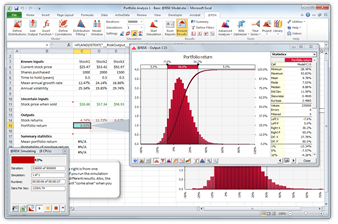
2. Understand Your Risks
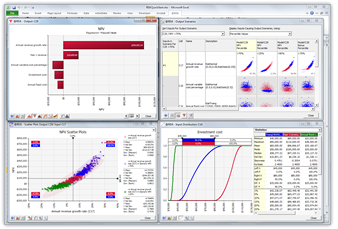
The result of a simulation is a look at a whole range of possible outcomes, including the probabilities they will occur. Graph your results with histograms, Scatter Plots, cumulative curves, Box Plots, and more. Identify critical factors with Tornado charts and sensitivity analysis. Paste results into Excel, Word, or PowerPoint, or place them in the @RISK Library for other @RISK users. You can even save results and charts right inside your Excel workbook.
Clear, Easy-to-Understand Results
@RISK provides you with sensitivity and scenario analyses to determine the critical factors in your models. Use sensitivity analysis to rank the distribution functions in your model according to the impact they have on your outputs. See the results clearly with an easy-to-interpret Tornado diagram, or uncover relationships with Scatter Plots. Sensitivity analysis pre-screens all inputs based on their precedence in formulas to outputs in your model, thus reducing irrelevant data. In addition, you can use @RISK’s Make Input function to select a formula whose value will be treated as an @RISK input for sensitivity analysis. In this way, multiple distributions can be combined into a single input, streamlining your sensitivity reports.
All simulation results for both outputs and inputs are summarized—with thumbnail graphs—in the dashboard-style @RISK Results Summary window. Simulation results may be saved directly in your Excel workbook, and also placed in the @RISK Library to for sharing with other @RISK users.
Excel Ease of Use @RISK is a true add-in to Microsoft Excel, integrating completely with your spreadsheet. Browse, define, analyze—while never leaving Excel. All @RISK functions are true Excel functions, and behave exactly as native Excel functions do. @RISK windows are all linked directly to cells in your spreadsheet, so changes in one place are carried out in the other. @RISK graphs point to their cells via callout windows. Drag-and-drop ease, context-sensitive right-click menus, and the @RISK toolbar make learning and navigating @RISK a snap.
3. Run the Simulation Click the Simulate button and watch. @RISK recalculates your spreadsheet model thousands of times. Each time, @RISK samples random values from the @RISK functions you entered, places them in your model, and records the resulting outcome. Explain the process to others by running your simulation in Demo Mode, with graphs and reports updating live as the simulation runs. |
@RISK 8 is a major upgrade that represents the culmination of feedback from thousands of users. We focused on what is most important to you, based on the analyses you do every day. Furthermore, @RISK 8 has been rebuilt on the latest programming technology from the ground up. This forward-looking foundation ensures that @RISK will continue to provide the most reliable, accurate, and robust quantitative risk analysis available anywhere for years to come. But make no mistake: while @RISK 8 is better, faster, and stronger than ever, it is still as easy to use as 1-2-3. The three basic steps to using @RISK still apply: Model. Simulate. Understand. This guide will walk you through some highlights to that simple process, and to @RISK as a whole.
| FRESH NEW LOOK, STREAMLINED WORKFLOWS
Modern, Redesigned, Intuitive Interface
This exciting new version has been redesigned based on significant user input. As a result, the interface is now more intuitive for both new and experienced practitioners alike, reducing learning curves and the time it takes to perform analyses. From an all-new command Ribbon to fresh dialog layouts, @RISK 8 offers a thoroughly modern look and feel throughout the entire application.
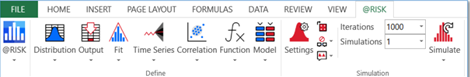
New Ribbon features consolidation of like commands and modern split buttons
The new @RISK 8 Ribbon in Excel is more logically organized with a refreshed look.
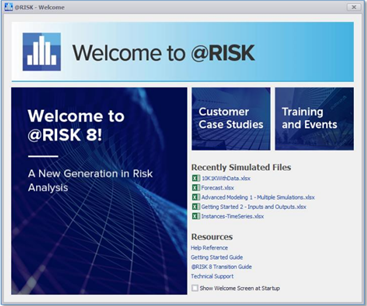
Save Clicks with the New Welcome Screen
The updated @RISK Welcome screen contains a list of recently simulated workbooks, making it easy for users to pick up where they left off. It also contains quick links to helpful support and resources within the software and on the web.
The new @RISK Welcome Screen lets you pick up right where you left off.
You Entire Analysis at a Glance in the New Model and Results Windows
The @RISK Model and Results Windows have long been handy places to manage and view all the input variables and simulation results in your model. Both have been redesigned to significantly streamline the display of your model information. Other improvements include:
Faster editing of your models
The new @RISK Model Window stores an unlimited number of inputs and other model components.
FASTER PERFORMANCE Model Creation and Editing
From defining input distributions to correlating variables to identifying output cells, every aspect of model management has been re-engineered for fewer lags and overall more responsive performance. Some examples of faster performance include:
Defining distributions
Results Analysis and Reporting
Likewise, from analysis of simulation data to the generation or reports to share with others, everything to do with results analysis has been significantly sped up. In addition, you have greater control than ever, with more progress bars and ways to cancel long operations. Some examples of faster performance include:
Generating simulation reports in Excel – up to 10x faster than before
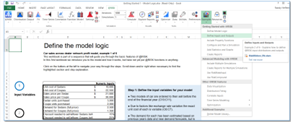
MODEL: SETUP JUST GOT EASIER Speed Model Setup with All-New Distribution Selection and Fitting
The Define Distribution window, the first step in any @RISK analysis, has been overhauled to simplify anything you may need to do when creating or editing @RISK distribution functions to define uncertainty in your models.
Display multiple views of functions by type or by user-defined favorites
The new and improved Defined Distribution Window streamlines the definition of uncertain variables.
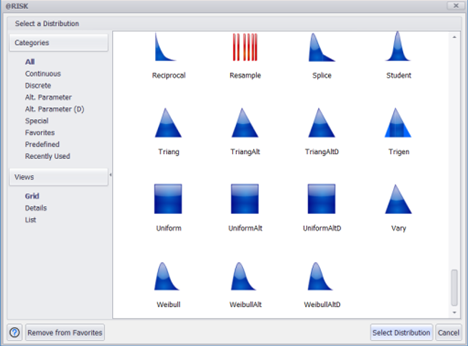
The new @RISK Distribution Selector makes navigating distribution options a breeze.
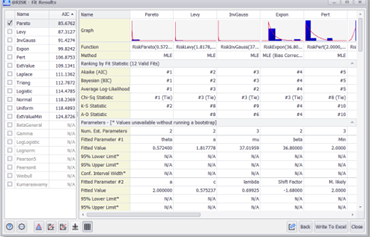
New Distribution Fit Results report with thumbnail graphs for visual cues to the best distribution.
Improve Model Accuracy with Enhanced Correlations and Copulas
A number of enhancements have been made to the @RISK’s correlations feature, which allows you to define accurate relationships between related input distribution functions, and the copulas feature, which are functions used to model dependency between inputs in financial applications.
Correlations and copulas now share a common, logical interface
Enhanced Modeling of Time Series
@RISK’s Time Series feature allows you to model the uncertainty around variables whose nature is a series of values over time, such as commodities prices. New version 8 adds significant improvements to this key functionality:
New correlation of time series input functions
SIMULATE: ONE BUTTON, MANY SIMULATIONS Perform Advanced Simulations with the Simulation Split Button
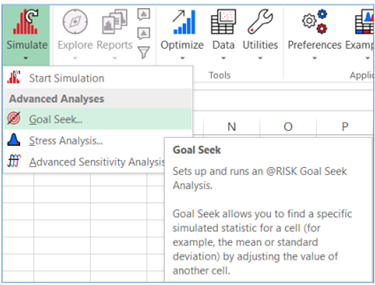
The new Simulation split button menu provides intuitive, one-click access to simulation-related analyses — Goal Seek, Stress Analysis, and Advanced Sensitivity – that were previously hard to find.
The new @RISK 8 Simulation split button menu provides logical access to simulation variations.
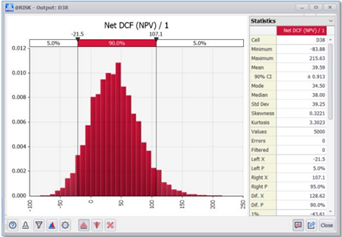
UNDERSTAND: MORE WAYS TO INTERPRET AND SHARE SIMULATION RESULTS Analysis at a Glance in the Redesigned Browse Results Window
The Browse Results Window has been significantly changed with the goal of simplifying the most common tasks. In addition, new functionality puts sophisticated insights at your fingertips.
A new overlay manager that allows you much more control of how overlays are displayed
The new, streamlined @RISK Browse Results window shows you just what you need. |
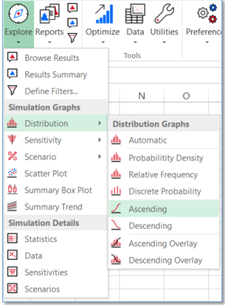
Insights in Just One Click with the New Explore Menu
The new Explore menu contains everything you need to gain insights from your simulation results. Bring up the Browse Results Window, the Results Summary Window, and the Filter Dialog, or, choose from all of the different @RISK result windows.
The new @RISK 8 Explore menu for one-click access to simulation results.
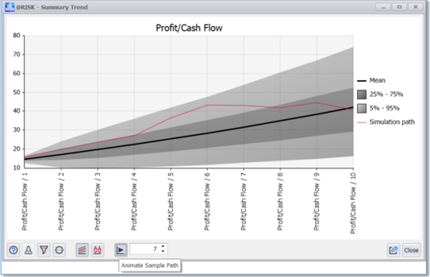
Understand Results Over Time with the New Summary Trend Graph
The new Summary Trend graph in @RISK 8 offers an updated look as well the ability to display a single sample simulation path on top of the trend for any iteration you specify. You can also animate this overlay to see a sequence of sample paths in succession.
The new @RISK Summary Trend graph with animated sample simulation path
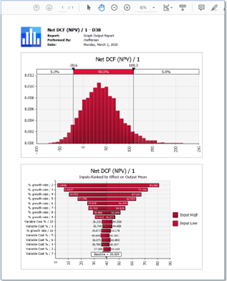
Communicate Results Cleary with @RISK Reports
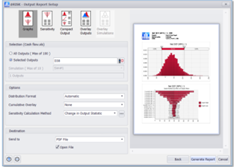
You can now create presentation-quality simulation reports for sharing with others much more easily. Use the built-in report templates, or create your own. @RISK 8 includes an entirely new feature set for report generation, simplifying the process, enhancing flexibility, improving the quality, and doing it faster than ever.
Simplified report generation interface
The @RISK Output Report Setup dialog allows you to configure and preview reports.
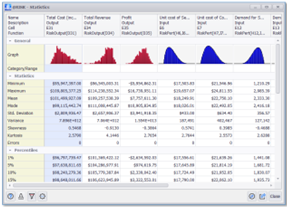
More Improvements to Simulation Results
The window improvements have been carried throughout @RISK, including the Statistics, Data, Sensitivity, and Scenarios windows.
Thumbnail graphs have been added to the Statistics window to give visual cues to the reported statistics
The new @RISK 8 Statistics window, with thumbnail graphs, exporting options, and more
GET STARTED FAST Intuitive Learning with All-New Tutorial Examples
@RISK 8 ships with an all-new tutorial in the form of step-by-step example spreadsheets that are designed with ease-of-use and sequential learning in mind. Each example builds on the one before, and all interactively allow you to step through them with point-and-click ease. The new example library has been rewritten by professional consultants to help decision makers get results fast, out of the box.
Models are succinct and easy to follow
The all-new tutorial examples in @RISK 8
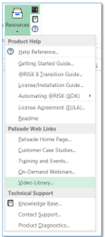
RESOURCES TO SUPPORT YOU, 24/7
A new Resources menu opens the door to wealth of learning options and references. From Getting Started guides to What’s New documentations, there is something for new and existing users alike. Plus, access to technical support tools is included.
@RISK’s new Resources menu gives you one-click access to guides, technical support, and much more.
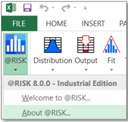
SIMPLY, EASY APPLICATION MANAGEMENT Get Notifications and More in the New @RISK Menu on the Ribbon
The new “@RISK” menu on the Ribbon includes important notifications about @RISK as well as allows easier access to manage your @RISK license.
Notifications provide important messages (such as the availability of updates) without
The @RISK menu on the @RISK Ribbon in Excel gives you notifications without interrupting your work.
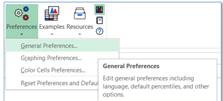
New Preferences Menu Makes Setting Defaults a Snap
@RISK 8 allows you to manage application-wide preferences and settings much more easily than ever. A new Preferences menu on the Ribbon lets you adjust general @RISK settings, common graph defaults (which can be adjusted by individual graph type as well), and color preferences for denoting cells with @RISK functions.
The new @RISK 8 Preferences menu lets you control @RISK defaults with ease
BUILT FOR THE LATEST TECH ENVIRONMENTS Tighter excel Integration for More Cohesive Analyses
@RISK 8 takes full advantage of changes made in more recent releases of Excel, while still maintaining backward compatibility with models created in older versions of Excel and @RISK.
Improved support for Excel’s OneDrive auto-save functionality
Enhanced Display Support
Because @RISK is used so widely for its graphical report and graphs, new version 8 displays these more crisply and effectively in a wide range of configurations, including high DPI settings and multiple monitors. On-screen animations and movements are also smoother.
READY FOR THE FUTURE
While @RISK 8 is a substantial upgrade in its own right, it also represents the birth of a new platform which will launch an entire generation of risk analysis advances. The new @RISK is technologically poised to take advantage of future improvements in the field of probabilistic analysis as well as in Excel itself. Put simply, this ensures you can trust that @RISK will provide the best possible insights, whatever the future brings.
|
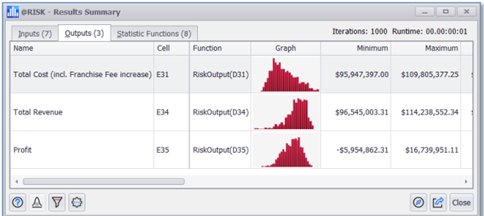 The streamlined and more flexible @RISK Results Summary Window lets you configure information how you want to see it.
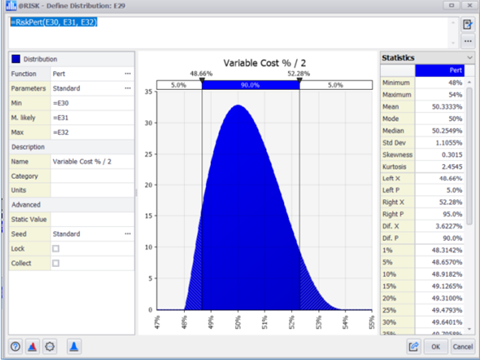
Operating Systems
@RISK requires Windows 7 (SP1 or later), Windows 8, or Windows 10.
While there is no support for running on the native Macintosh OS, @RISK will run on a Windows environment hosted on the Mac. The following configurations are supported:
Windows 7 through Windows 10 running, using Boot Camp.
Windows 7 through Windows 10 emulation using Parallels, VirtualBox, or VMware.
*UNIX operating systems are not supported.
Spreadsheets
An installed copy of Microsoft Excel 2010, 2013, 2016 or 2019 for Windows or Office 365 for Windows is required. Palisade add-ins will not run with earlier versions of Microsoft Excel.
*@RISK is not compatible with non-Microsoft spreadsheet packages.
The software is compatible with the “On Premises” deployment option of Office 365. It is not compatible with the “Office on Demand” or “Office Web Apps” deployment options.
Visual C++ Runtime Files
Palisade add-ins require the Microsoft Visual C++ “Universal” Runtime. On a 64-bit machine, both the 64-bit and 32-bit versions of this library are required. On a 32-bit machine, only the 32-bit version of this library is required. These will be installed automatically as part of the DTS installation if they are not found on the system.
Microsoft .NET Framework 4.6.1
Palisade software requires Microsoft .NET Framework 4.6.1. In Windows 7, the DecisionTools Suite installer will automatically install this component. In Windows 8 and Windows 10, the .NET Framework 4.0 is already installed as part of Windows. The .NET framework will be installed automatically as part of the DecisionTools Suite installation if it is not found on the system.
© Copyright 2026 Palisade Corporation.
Applicazione (add-in) che fornisce all’utente di Microsoft Excel o Lotus 1-2-3, la possibilità di effettuare analisi dei rischi e simulazioni.