LATENT CLASS MODEL-COMPARISON STATISTICS
Below, we analyze data from Stouffer and Toby (1951) on individuals’ responses to situations that require either siding with a friend (particularistic choice) or doing what is right for society (universalistic choice). There were four scenarios that people had to respond to: whether they would testify against a friend in an accident case (accident), whether they would give a negative review of a friend’s play (play), whether they would disclose health concerns to a friend’s insurance company (insurance), and whether they would keep a company secret that affects stock prices from a friend (stock).
We would like to identify and understand groups in the population with different patterns of responses to these questions.
Below, we fit latent class models with one, two, and three latent classes. After fitting the models, we will use lcstats to ascertain the best-fitting model. We type
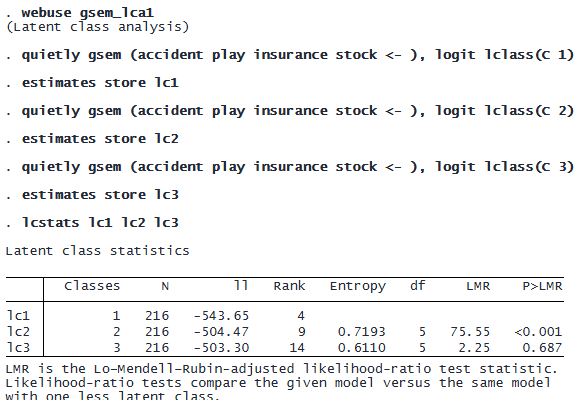
Above, we stored the estimates of each model and then computed statistics for each of them. The LMR-adjusted likelihood-ratio test in the second row tests whether the one-class model fits as well as the two-class model. The LMR statistic of 75.55 and small p-value provide evidence that the two-class model fits better than the one-class model. The LMR-adjusted likelihood-ratio test on the third line does not provide evidence that the three-class model fits better than the two-class model.
We could explore the models using all the information criteria allowed by lcstats by specifying the allic option:
![]()
This will expand the table to include four new columns. Alternatively, we could split the table into two parts: one table displaying the entropy and information criteria and the other displaying the likelihood-ratio test statistics.
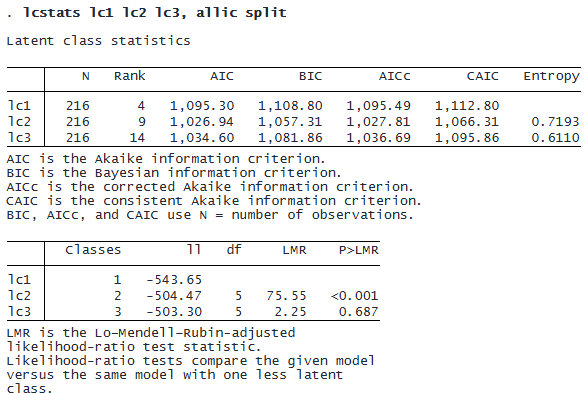
All our statistics indicate that a model with two latent classes is the best fit for our data.
CUSTOMIZABLE TABLES
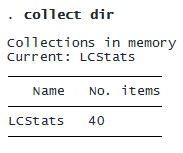
The lcstats command automatically stores its results in a collection, making it easy to customize and export tables with these results. For instance, say we want to export the first table we created above. After typing
![]()
© Copyright 1996–2026 StataCorp LLC. All rights reserved.
a collection named LCStats is now available.
If we are happy with the layout and formatting of the table produced by our lcstats command, we can use collect export to export the table to Word, Excel, LaTeX, and various other formats. For instance,
![]()
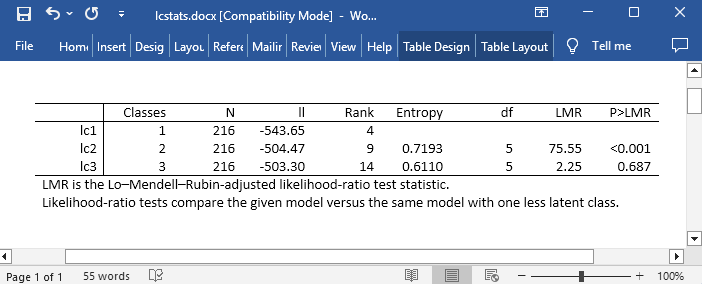
If we instead wanted to make any changes to the layout, labels, and formatting of the table before exporting, we could use the collect suite of commands.
We can also use the collect commands to create tables that combine results from lcstats with results from other commands. Below, we illustrate how to construct a table that has latent class probabilities of our fitted models as well as the information from lcstats. Additionally, we customize our table to show only a subset of the statistics and to not show the names we used for our estimates. First, we will show the complete table, and then we will show how to create it.
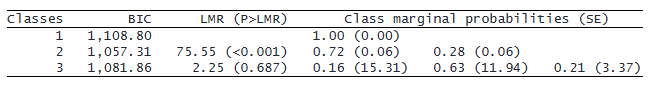
Above, we see the BIC and LMR that were reported by lcstats. But the table also shows class marginal probabilities of belonging to each latent class according to each model.
To create the table above, we first type
![]()
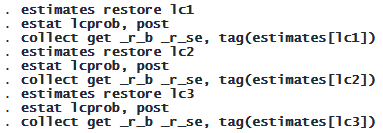
Then we collect marginal probabilities and standard errors from each model by using estat lcprob.
We style and format our table.
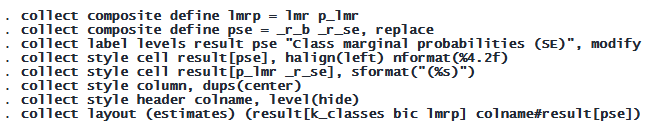
Finally, we export this table to a Microsoft Word file.
![]()