EViews supports a wide range of basic graph types including line graphs, bar graphs, filled area graphs, pie charts, scatter diagrams, mixed line-bar graphs, high-low graphs, scatterplots, and boxplots. Any number of graphs can be combined in a single graph for presentation.
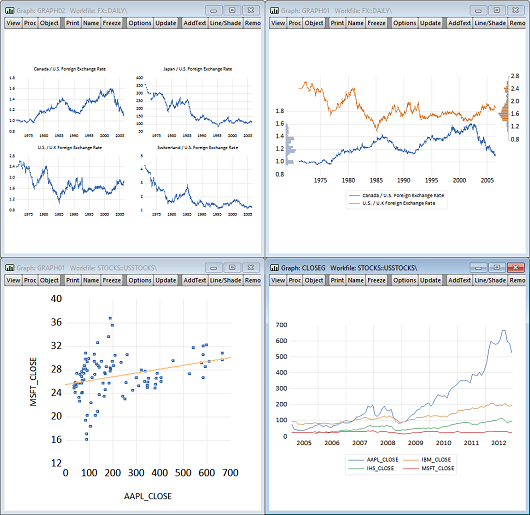
Various options give you control over line types, symbols, color, frame and border characteristics, headings, shading, and scaling, including logarithmic scaling and dual scale graphs. Legends are created automatically. You may further customize your graph by adding labels in any scalable Windows font.
Customizing a graph is as simple as modifying or moving graphic elements on the screen. Everything from aspect ratios, to line and symbol characteristics, to axes scaling and labeling is right at your fingertips. Want to change the font or other characteristics of a legend or a text label? Just click on an element of the graph and your choices are presented in an easy to understand dialog. You can even use a customized graph template to modify all of your graph settings at once.
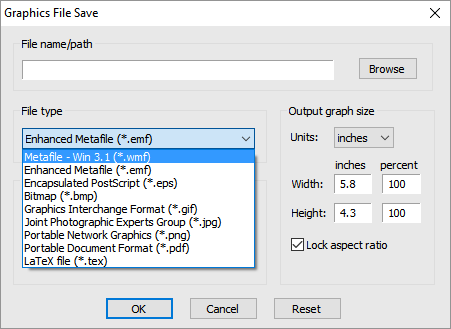
You can quickly incorporate customized graphs into other applications using copy-and-paste or by writing the graph to a Windows metafile, or a PostScript, bitmap, PNG, GIF, or JPEG file.
© 2026 S&P Global
You can also display ShapeFiles containing geographical maps, and tie regions of the map to data in EViews, allowing shading an labelling of the map based upon that data.
Extensive table customization tools allow you to produce presentation quality tables for inclusion in other programs. An easy-to-use, interactive interface gives you control over cell font face, size, and color, cell background color and borders, merging, and annotation.
When completed, you can copy-and-paste your customized table to another application or save it as an RTF, HTML, PDF, or text file.