TVCS WITH INTERVAL-CENSORED COX MODEL IN ACTION!
TESTING THE PROPORTIONAL-HAZARDS ASSUMPTION USING TVCS
Here we demonstrate how to use TVCs to test the proportional-hazards assumption of a Cox model. Following Zeng et al. (2016), we use an interval-censored Cox regression to model time to HIV infection of injecting drug users. All 1,124 subjects initially tested negative for HIV. They were followed and assessed for HIV-1 seropositivity through blood tests approximately every four months. Because the subjects were tested periodically, the exact time of HIV infection was not observed, but the times were known to fall in intervals between blood tests. The corresponding lower and upper time endpoints are recorded in variables ltime and rtime.
The baseline factors we use to model the HIV-1 seropositivity are centered age at recruitment (age_mean), sex (male), history of needle sharing (needle), history of drug injection (inject), and whether a subject has been in jail at the time of recruitment (jail). Here is a subset of the dataset for subjects 271 through 274 with one record per subject:
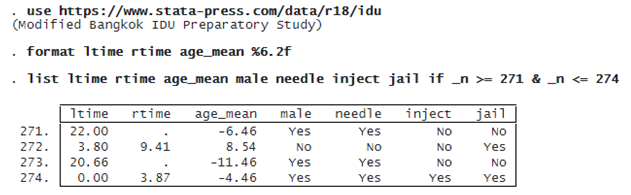
We fit a Cox proportional hazards model in which time to HIV infection depends on the above baseline factors. In a single-record-per-subject format, we specify the lower and upper event-time intervals in stintcox‘s interval() option.
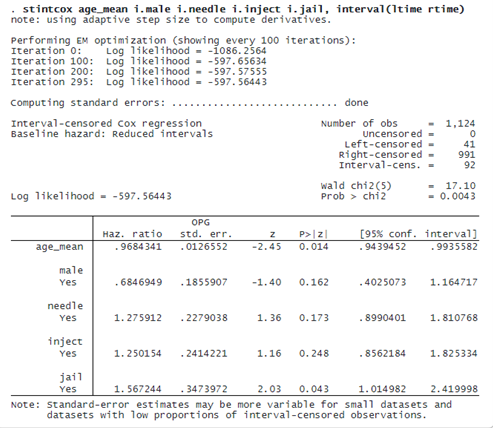
We find that age and being in jail at enrollment appear to be associated with, respectively, lower and higher risks of HIV infection.
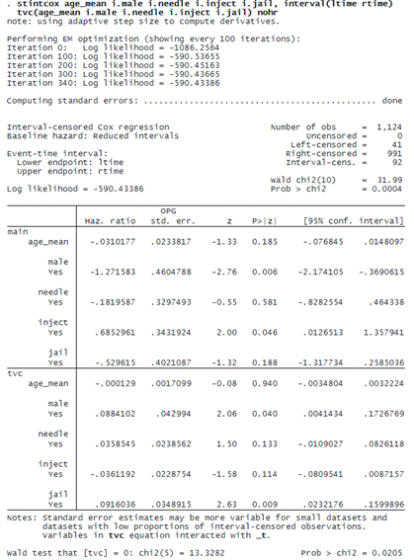
One way of testing the proportional-hazards assumption for a covariate is to test whether the coefficient associated with that covariate is time invariant. This can be accomplished by including an interaction between this covariate and a function of time in the model and testing whether the corresponding coefficient equals zero.
To test the proportional-hazards assumption in our example, we include all covariates in option tvc() to additionally include their interactions with the analysis time _t, the default, in the model. In this analysis, we suppress the default reporting of hazard ratios with option nohr:
FITTING AN INTERVAL-CENSORED COX MODEL USING TVCS IN MULTIPLE-RECORD DATA
In the previous example, we used stintcox‘s tvc() option to create TVCs to test the proportional-hazards assumption. In some applications, TVCs already exist in the dataset. Continuing with the data on injecting drug users, being in jail is a TVC. TVCs can be recorded only in multiple-record-per-subject data format. In this format, each subject may contain multiple records with multiple examination times, the event status at each examination time, and potential time-varying covariates at each examination time.
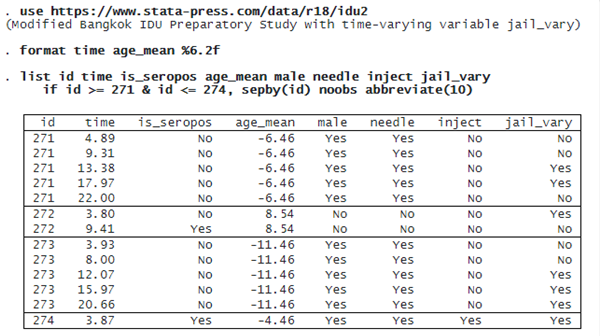
Let’s use an extended version, idu2.dta, of the previous idu.dta dataset, which contains all the baseline covariates as well as a time-varying imprisonment indicator variable (jail_vary). jail_vary indicates whether the subject has been imprisioned since the last clinic visit.
The dataset also records a subject identifier (id), the examination time of the blood test (time), and whether the blood test is positive at the examination time (is_seropos). Here is a subset of this dataset for subjects 271 through 274 with multiple records per subject:
© Copyright 1996–2026 StataCorp LLC. All rights reserved.
We refit the previous Cox model, but we now use the time-varying variable jail_vary instead of the baseline variable jail. In a multiple-record-per-subject format, we specify the subject identifier in option id(), the examination time in option time(), and the event-indicator status in option status().
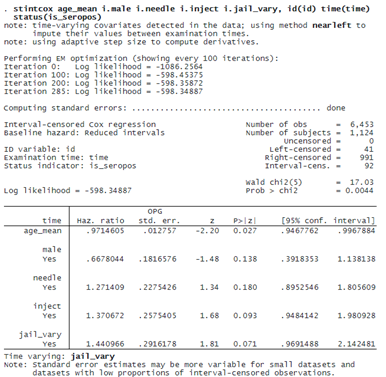
Compared with the previous example, after we account for time-varying imprisonment, the hazard ratio for inject increases from 1.25 to 1.37, but the effect of imprisonment decreases from 1.57 for baseline jail to 1.44 for time-varying jail_vary.
GRAPHING SURVIVOR FUNCTIONS
After fitting the model, we can use stcurve to plot the estimated survivor, failure, hazard, or cumulative hazard function. By default, stcurve evaluates the functions at the overall means of covariates.
. stcurve, survival
note: function evaluated at overall means of covariates.

With multiple-record data with TVCs, we may want to incorporate the time-varying nature of those covariates when plotting the functions. In this case, we can use option attmeans to evaluate the function at time-specific means.
. stcurve, survival attmeans
note: function evaluated at time-specific means of covariates.

We can also use option atframe() to specify our own TVC values to be used to evaluate the survivor function. Suppose we want to plot the survivor curve for an individual with the same covariate pattern as subject 1 in our dataset. We create a new frame called id1 and use frame put to copy the relevant information for subject 1 to this new frame. We list the data we just saved in frame id1.
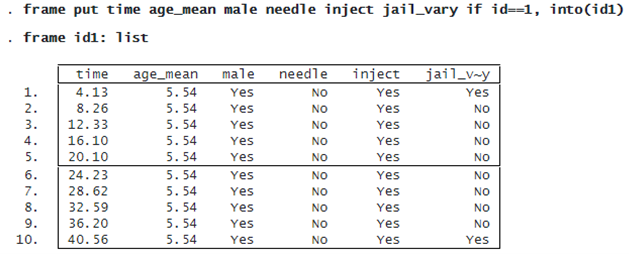
Then we can graph the survivor curve for this particular profile by typing
. stcurve, survival atframe(id1)
note: function evaluated at specified values of selected covariates and overall
      means of other covariates (if any).
note: covariate values from frame id1 used to evaluate function.
