SUMMARIES
- Arithmetic, geometric, and harmonic means, and corresponding confidence intervals
- Medians and percentiles
- Measurement of central tendency
- Skewness and kurtosis
- Confidence intervals
- Means
- Normal
- Exact Poisson
- Proportions
- Exact binomial (Clopper–Pearson)
- Wald
- Wilson
- Jeffreys
- Agresti
- Variance
- Normal
- Bonett
- Means
- Ratios, proportions, and totals
- Confidence intervals
- Standard errors
- Over groups
- Robust and cluster–robust SEs
- Intragroup tests
TABLES AND TABULATIONS
- 1- , 2-, n-way
- Pearson’s chi-squared
- Likelihood-ratio chi-squared
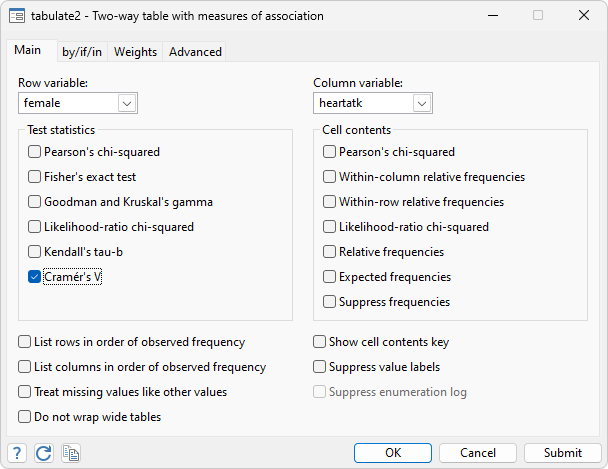
- Cramér’s V
- Fisher’s exact (2 x 2 and r x c)
- Goodman and Kruskal’s gamma
- Kendall’s tau
- Cell statistics
- Expected count
- Contribution to Pearson chi-squared
- Contribution to likelihood-ratio chi-squared
Video – Combining crosstabs and descriptives in Stata
Video – Crosstabs and chi-squared tests calculator
TABLES OF SUMMARY STATISTICS
- Over groups and/or variables
- Statistics may include mean, count, sum, min, max, range, standard deviation, variance, variation coefficient, standard error of mean, skewness, kurtosis, median, percentiles, and interquartile range
- Results from any summary-statistics command
CREATION OF DATASETS OF SUMMARY STATISTICS
- Statistics by group or subgroup of observations
- Statistics: mean, standard deviation, count, min, max, median, percentiles, and interquartile range
PAIRWISE COMPARISONS OF MEANS
- Pairwise differences in means with tests and confidence intervals
© Copyright 1996–2024 StataCorp LLC. All rights reserved.
- Multiple-comparison adjustments: Bonferroni, Šidák, Scheffé, Tukey HSD, Duncan, and Student–Newman–Keuls adjustments
- Group comparisons that are significant
- Balanced and unbalanced data
T TESTS
- One sample
- Two independent samples
- Two paired samples
- Based on summary data (ttesti)
Video – t-test for two independent samples in Stata
Video – t-test for two paired samples in Stata
Video – One sample t-tests calculator
Video – Two sample t-tests calculator
Z TESTS
- One sample
- Two independent samples
- Two paired samples
- Support for clustered data
- Based on summary data (ztesti)
TESTS OF PROPORTIONS
- One sample
- Two sample
- Support for clustered data
- Based on summary data (prtesti)
EFFECT SIZES
- Comparison of means
- Cohen’s d
- Hedge’s g
- Glass’s Δ
- Point/biserial correlation
- Confidence intervals
- Variance explained by regression and ANOVA
- Eta-squared—η2
- Omega-squared—ω2
- Confidence intervals
Video – A tour of effect sizes
OTHER COMMON TESTS
- Binomial (one-sample) test
- Bartlett’s test
- Chi-squared (one-sample) variance test
- Variance ratio (two-sample) F test
CORRELATIONS
- Pearson simple and partial
- Semipartial
- Spearman’s rank correlation
- Kendall’s rank correlation
- Intracluster
- Cronbach’s alpha
- Tetrachoric
- Canonical (multivariate) correlations
- Intraclass
FACTOR VARIABLES
- Automatically create indicators based on categorical variables
- Form interactions among discrete and continuous variables
- Include polynomial terms
- Perform contrasts of categories/levels


