BINARY RESPONSE MODELS
- One-parameter logistic (1PL)
- Two-parameter logistic (2PL)
- Three-parameter logistic (3PL)
Video – One-parameter logistic (1PL) models
Video – Two-parameter logistic (2PL) models
Video – Three-parameter logistic (3PL) models
Video – Two-parameter logistic (2PL) models
Video – Three-parameter logistic (3PL) models
ORDINAL RESPONSE MODELS
- Graded response
- Partial credit
- Generalized partial credit
- Rating scale
CATEGORICAL RESPONSE MODEL
- Nominal response
Video – Nominal response (NRM) models
HYBRID MODELS WITH DIFFERING RESPONSE TYPES
MULTIPLE-GROUP IRT MODELS
- Allow parameters to vary across groups
- Constrain parameters across groups to be equal
- Available for all IRT models
- Test for differences across groups
Video – IRT models for multiple groups
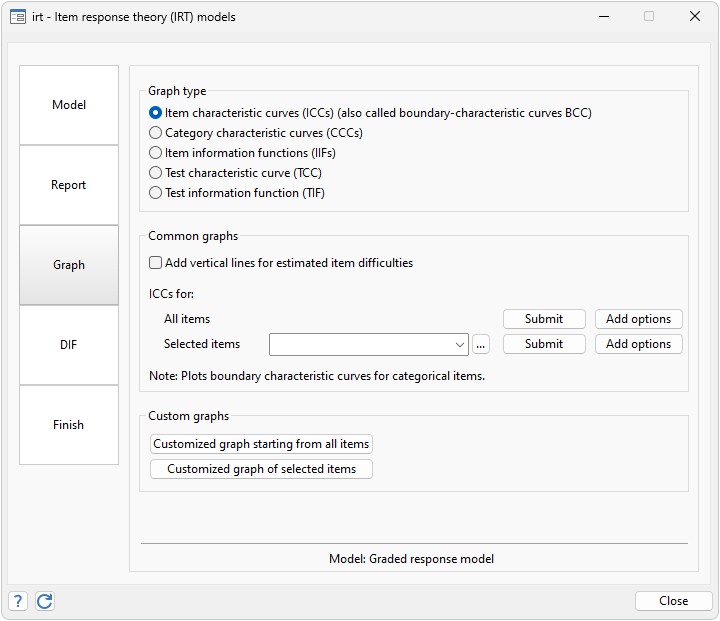
GRAPHS
- Item characteristic curves and boundary characteristic curves
- Plot midpoint probabilities
- Category characteristic curves
- Test characteristic curve
- Plot expected score for a specified ability level
- Plot ability for a specified expected score
- Item information functions
- Test information function
- Plot the standard error
- Fully customizable graphs
- Save your graphed results as datasets for future use

© Copyright 1996–2024 StataCorp LLC. All rights reserved.
DIF DIAGNOSTICS
- Mantel–Haenszel test
- Logistic regression test
- IRT model-based test

CONTROL PANEL INTERFACE
- Access all IRT features
- Easily select response type and item variables
- Even create hybrid models
- Estimate models
- Select and customize graphs
- Manage reporting of results
CONTROL HOW YOUR OUTPUT IS DISPLAYED
- Sort by difficulty
- Sort by discrimination
- Group estimates by type or by item
- Show results only for selected items
- Compare IRT estimates across groups
POSTESTIMATION SELECTOR
- View and run all postestimation features for your command
- Automatically updated as estimation commands are run
Video – Postestimation Selector