FACTOR ANALYSIS
- Works on datasets or correlation matrices
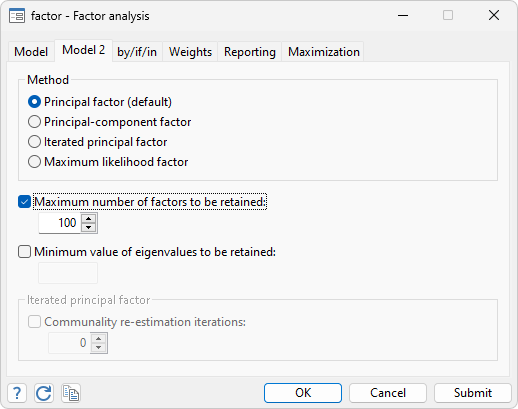
- Principal-components factor
- Principal factor
- Iterated principal factor
- ML factors
- Rotations
- Orthogonal and oblique rotations
- Kaiser normalization
- Varimax, quartimax, oblimax, parsimax, equamax, and promax rotation
- Minimum entropy rotation
- Comrey’s tandem
- Rotate toward a target matrix
- Anti-image correlation matrices
- Kaiser–Meyer–Olkin measure of sampling adequacy
- Loading plots, score plots, and scree plots
- Squared multiple correlations
- Bartlett scoring
- Regression scoring
PRINCIPAL COMPONENTS
- Works with datasets or correlation or covariance matrices
- Standard errors of eigenvalues and vectors
- Anti-image correlation matrices
- Kaiser–Meyer–Olkin measure of sampling adequacy
- Loading plots, score plots, and scree plots
- Squared multiple correlations
- Rotations
- Orthogonal and oblique rotations
- Kaiser normalization
- Varimax, quartimax, oblimax, parsimax, equamax, and promax rotation
- Minimum entropy rotation
- Comrey’s tandem
- Rotate toward a target matrix
DISCRIMINANT ANALYSIS
- Linear
- Quadratic
- Logistic Updated
- kth nearest neighbor Updated
- Classification tables
- Error rates
ZELLNER’S SEEMINGLY UNRELATED REGRESSION
- Two-step or maximum likelihood estimates
- Linear constraints
- Breusch-Pagan test for independent equations
MULTIVARIATE LINEAR REGRESSION
- Breusch–Pagan test for independent equations
- Bayesian multivariate regression
PROCRUSTES ANALYSIS
- Orthogonal, oblique, and unrestricted transformations
- Overlaid graphs comparing target variables and fitted values of source variables
CANONICAL CORRELATIONS
- Correlation matrices
- Loading matrices
- Rotate raw coefficients, standard coefficients, or loading matrices
- Compare rotated and unrotated coefficients or loadings
- Plot canonical correlations
TETRACHORIC CORRELATIONS
- Maximum likelihood or noniterative Edwards and Edwards estimator
- Tetrachoric correlation coefficient and standard error
- Exact two-sided significance level
© Copyright 1996–2024 StataCorp LLC. All rights reserved.
STRUCTURAL EQUATION MODELING (SEM)
- Complete implementation
LATENT CLASS ANALYSIS
- Including latent profile analysis
- Including finite mixture models
- Marginal probabilities and marginal means
- Evaluate goodness of fit
- Predict probabilities of class membership and values of observed outcome variables
Video – Latent class analysis (LCA)
CLUSTER ANALYSIS
- Complete implementation
MANOVA
- Complete implementation
MULTIVARIATE TESTS
- One- and multisample
- Means, covariances, and correlations
- Tests of normality
- Doornik–Hansen
- Henze–Zirkler
- Two by Mardia
MULTIDIMENSIONAL SCALING
- Modern metric and nonmetric multidimensional scaling
- Classic metric multidimensional scaling
- Works with two-way data, proximity data in long format, and proximity data in a matrix
- 33 similarity/dissimilarity measures
- Coordinates of approximating configuration
- Correlations between dissimilarities and distances
- Kruskal stress measure
- Shepard diagram
- Plots of approximating Euclidean configuration
CORRESPONDENCE ANALYSIS
- Two-way correspondence analysis
- Work with cross-tabulations of categorical variables or matrices of counts
- Stacked (crossed) variables
- Fitted, observed, and expected correspondence tables
- Coordinates in column space
- Coordinates in row space (with two-way CA)
- Row and column profiles (conditional distributions)
- Chi-squared distances
- Correlations of profiles and axes
- Inertia contributions
- Biplots
- Projection plots
- Multiple and joint correspondence analysis (MCA and JCA)
- Work with cross-tabulations of categorical variables
- Stacked (crossed) variables
- Coordinates in column space
- Projection plots
- Matrix of inertias (after JCA)
POSTESTIMATION SELECTOR
- View and run all postestimation features for your command
- Automatically updated as estimation commands are run
Video – Postestimation Selector
BIPLOTS
- Display your choice of any two biplot dimensions
- Distinguish groups of data within the biplot
- Display table of biplot coordinates
- Generate new variables containing biplot coordinates
HOTELLING’S T-SQUARED
CRONBACH’S ALPHA
- Interitem correlations or covariances
- Generate summative scale
- Automatically reverse sense of variables