DATA SETUP AND EFFECT SIZES
- Effect sizes for two-sample binary data
- Odds ratio
- Peto’s odds ratio
- Risk ratio
- Risk difference
- Effect sizes for two-sample continuous data
- Hedges’s g
- Cohen’s d
- Glass’s delta (two versions)
- Unstandardized mean difference
- Effect sizes for one-sample binary data (prevalence data)
- Freeman–Tukey-transformed proportion
- Logit-transformed proportion
- Raw proportion
- Generic (precomputed) effect sizes
- Transformed effect sizes such as correlations and efficacies
- Different methods for zero-cells adjustment with binary data
- Update declared meta-analysis settings at any time
- Describe declared meta-analysis settings
Video – Meta-analysis for prevalence
META-ANALYSIS MODELS
- Common-effect model
- Inverse-variance method
- Mantel–Haenszel method
- Fixed-effects model
- Inverse-variance method
- Mantel–Haenszel method
- Random-effects model
- Iterative methods: REML, MLE, and empirical Bayes
- Noniterative methods: DerSimonian–Laird, Hedges, Sidik–Jonkman, and Hunter–Schmidt
- Knapp–Hartung standard-error adjustment
- Prediction intervals
- Sensitivity analysis: User-specified values for heterogeneity parameters tau2 and I2
META-ANALYSIS SUMMARY
- Standard meta-analysis
- Forest plots
- Subgroup meta-analysis
- One grouping variable
- Multiple grouping variables
- Subgroup forest plots
- Cumulative meta-analysis
- Standard analysis
- Stratified analysis
- Cumulative forest plots
- Leave-one-out meta-analysis
FOREST PLOTS
- Standard forest plot
- Custom forest plot
- Subgroup forest plot
- Cumulative forest plot
- Leave-one-out forest plot
- Cropped CI ranges
- Multiple overall effects

HETEROGENEITY
- Basic summary
- Forest plots
- L’Abbé plots for binary data
- Subgroup meta-analysis
- Meta-regression
- Bubble plots
- Galbraith plots
META-REGRESSION
- Continuous and categorical moderators
- Fixed-effects and random-effects regression
- Multiplicative and additive residual heterogeneity
- Knapp–Hartung standard-error adjustment
- Postestimation features
- Fitted values
- Residuals
- Random effects
- Standard errors of predicted quantities
- Bubble plots
- Other standard postestimation tools such as margins, contrasts, and more
© Copyright 1996–2024 StataCorp LLC. All rights reserved.
SMALL-STUDY EFFECTS
- Funnel plots
- Tests for small-study effects
FUNNEL PLOTS
- Standard funnel plots
- Contour-enhanced funnel plots
- Two-sided or one-sided significance contours
- Multiple precision metrics for the y-axis
- Stratified funnel plots
- Fully customizable
TESTS FOR FUNNEL-PLOT ASYMMETRY OR SMALL-STUDY EFFECTS
- Egger regression-based test
- Harbord regression-based test
- Peters regression-based test
- Begg rank correlation test
- Adjust for moderators to account for heterogeneity
- Traditional and random-effects versions
PUBLICATION BIAS
- Funnel plots
- Tests for funnel-plot assymetry
- Nonparametric trim-and-fill method
- Three estimators for number of missing studies
- Impute studies on the left or right side of the funnel plot
- Nine estimation methods for the iteration stage
- Nine estimation methods for the pooling stage
- Choose the side of the funnel plot with missing studies
- Standard and contour-enhanced funnel plot for the observed and imputed studies

MULTIVARIATE META-REGRESSION
- Multivariate meta-analysis
- Fixed-effects and random-effects multivariate meta-regression
- Estimation methods: REML, MLE, Jackson—White—Riley
- Multivariate heterogeneity statistics
- Jackson—Riley standard-error adjustment
- Between-study covariance structures
- Sensitivity analysis
- Missing values
- Postestimation features
- Fitted values
- Residuals
- Random effect
- Standard errors of predicted quantities
- Assess heterogeneity
- Other standard postestimation tools such as margins, contrasts, and more
MULTILEVEL META-REGRESSION
- Multilevel meta-analysis
- Multilevel meta-regression with random slopes
- Estimation methods: REML and MLE
- Multilevel heterogeneity statistics
- Random-effects covariance structures
- Sensitivity analysis
- Postestimation features
- Fitted values
- Residuals
- Random effects
- Standard errors of predicted quantities
- Assess heterogeneity
- Other standard postestimation tools such as margins, contrasts, and more.
Video – Multilevel meta-analysis
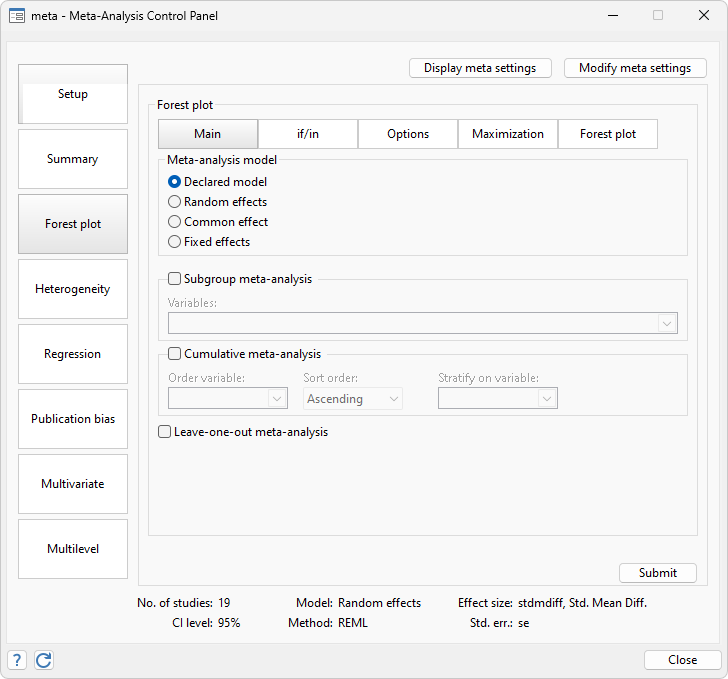
CONTROL PANEL
- Set up data and compute effect sizes
- Update specific characteristics at any time
- Summarize results in tables and produce forest plots
- Perform subgroup analysis and cumulative meta-analysis
- Perform meta-regression and pick from a variety of postestimation tools
- Perform publication bias analysis
- Perform multivariate meta-regression and pick from a variety of postestimation tools
- Perform multilevel meta-regression and pick from a variety of postestimation tools