GOALS
This tutorial builds on the first four econometrics tutorials. It is suggested that you complete those tutorials prior to starting this one.
This tutorial demonstrates how to test for influential data after OLS regression. After completing this tutorial, you should be able to:
- Calculate and plot leverage.
- Calculate and plot standardized residuals.
- Calculate and plot studentized residuals.
INTRODUCTION
When estimating a linear model using OLS, we want to insure that the results represent the data sample and are not being driven by any extraordinarily influential data points. Residuals, leverage and influence are all tools that can help us find outliers and influential data points:
- Residuals help to locate sample outliers whose responses do not follow the general trend of the rest of the data.
- Leverage, on the other hand, helps to locate sample outliers in terms of our independent variables. High leverage observations, those with leverage >
 , are observations where the independent variables are far from other observations.
Outliers and high leverage observations are a concern because of the potential they possess to unduly influence regression analysis.
LEVERAGE
The leverage of a variable comes directly from the regression prediction matrix
H=X(X′X)−1X′
The diagonal terms of this matrix, hii, quantify the influence that an observed response has on the predicted value ^yi. If hii is small, then the observed response has little influence on ^yi. Conversely, if hii is large, then the observed response has big influence on ^yi. As a general rule of thumb, high-leverage observations are those with leverage greater that ![]() , where k is the number of predictors and N is the number of observations.
, where k is the number of predictors and N is the number of observations.
COMPUTE LEVERAGE
We will use the same data and regression results used in the previous econometrics tutorials to compute the leverage for each observation.
 // Leverage
 H = x * inv(x'x) *x';

// Extract diagonal of of 'H'
 leverage = diag(H);
PLOT LEVERAGE WITH SQUARED RESIDUALS
Leverage helps us locate abnormal data points in relation to the independent variables. However, we also are concerned with abnormalities that occur in the dependent variable. Plotting leverage against the squared normalized residuals provides us a means of simultaneously identifying outliers and high-leverage data points. Before charting, we normalize the residual using
![]()
 // Squared residuals
 sq_resid = resid.^2;

// Calculate standardized residuals
 norm_resid = resid / sqrt(resid'*resid);
 norm_sq_resid = norm_resid.^2;
Now plot the leverage against the normalized residuals squared. We include a vertical line at the average normalized residual and a horizontal line at the average leverage. This makes it easier to identify above and below average residuals and leverage.
/*
 ** Plot leverage vs. normalized square residual
 ** Declare plotControl structure
 */
 struct plotControl myLeveragePlot;

// Fill 'myLeveragePlot' with default scatter settings
 myLeverageplot = plotGetDefaults("scatter");

// Add axis labels to graph
 plotSetXLabel(&myLeveragePlot, "Normalized residual squared", "Arial", 14);
 plotSetYLabel(&myLeveragePlot, "Leverage");

/*
 ** Set axis range
 ** Y-axis Range
 */
 y_max = 0.07;
 plotSetYRange(&myLeveragePlot, 0, y_max);

// X-Axis Range
 x_max = 0.03;
 plotSetXRange(&myLeveragePlot, 0, x_max);

// Create scatter plot
 plotScatter(myLeveragePlot, norm_sq_resid, leverage);

plotSetLineColor(&myLeverageplot, "black");
 plotSetLineSymbol(&myLeveragePlot, -1);

// Add average leverage line
 ave_leverage = reshape(meanc(leverage), 2, 1);

x_ave_leverage = 0|x_max;
 plotAddXY(myLeveragePlot, x_ave_leverage, ave_leverage);

// Add average normalize residual squared line
 ave_sq_resid = reshape(meanc(norm_sq_resid), 2, 1);

y_ave_sq_resid = 0|y_max;
 plotAddXY(myLeveragePlot, ave_sq_resid, y_ave_sq_resid);

STANDARDIZED RESIDUALS
Ordinary regression residuals provide an imperfect tool for identifying outliers because they are dependent on units of measurement. To eliminate the dependence on units of measure, we can use the standardized and studentized residuals. Standardized residuals are derived by dividing residuals by an estimate of their standard deviation
Standardized residuals quantify how large the residuals are in standard deviations, providing a versatile tool for identifying outliers. As a rule-of-thumb, an observation with a standardized residual that is larger than 3 is considered an outlier.
/*
 ** Internally standardized residuals
 ** Calculate MSE
 */
 mse = meanc(sq_resid);

// Root mse of regression
 s = sqrt(mse);

// Calculate standardized residual
 resid_standard = resid./sqrt(mse*(1 - leverage));

/*
 ** Plot leverage vs. normalized square residual
 ** Declare plotControl structure
 */
 struct plotControl myResidPlot1;

// Fill 'myResidPlot1' with default scatter settings
 myResidPlot1 = plotGetDefaults("scatter");

/*
 ** Set plot labels
 ** Add title to graph
 */
 plotSetYLabel(&myResidPlot1, "Standardized Residuals", "Arial", 14);

// Create scatter plot
 plotScatter(myResidPlot1, x, resid_standard);

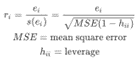
STUDENTIZED RESIDUALS
While standardized residuals offer a more universal criterion for identifying outliers, they can overlook potential outliers if those outliers have too strong of an influence on the regression model. Studentized residuals address this issue by comparing the observed response values to the fitted values based on the model with the ith observation deleted. The more influence an outlier has on the fitted regression, the larger the studentized residual will be.
 /*
 ** Studentized residual
 ** T-k-1
© 2026 Aptech Systems, Inc. All rights reserved.
*/
 denom_1 = num_obs - cols(x) - 1;
 denom_2 = denom_1*(1 - leverage);
// Root MSE with jth observation removed
 s_j = (mse*(num_obs-cols(x)))/denom_1 - sq_resid./denom_2;
// Studentized residual
 r_j_denom = s_j.*sqrt(1 - leverage);
 r_j = resid./r_j_denom;

/*
 ** Plot leverage vs. normalized square residual
 ** Declare plotControl structure
 */
 struct plotControl myResidPlot2;

// Fill 'myResidPlot2' with default scatter settings
 myResidPlot2 = plotGetDefaults("scatter");

/*
 ** Set plot labels
 ** Add title to graph
 */
 plotSetTitle(&myResidPlot2, "Studentized Residuals", "Arial", 14);
 plotSetXLabel(&myResidPlot2, "X");

// Create scatter plot
 plotOpenWindow();
 plotScatter(myResidPlot2, x, r_j);

CONCLUSION
Congratulations! You have:
- Calculated and plotted leverage.
- Calculated and plot standardized residuals.
- Calculated and plot studentized residuals.
The next tutorial examines methods for testing for multicollinearity.
For convenience the full program text is below.
// Clear the work space
 new;

// Set seed to replicate results
 rndseed 23423;

// Number of observations
 num_obs = 100;

// Generate independent variables
 x = rndn(num_obs, 1);

// Generate error terms
 error_term = rndn(num_obs,1);

// Generate y from x and errorTerm
 y = 1.3 + 5.7*x + error_term;

// Turn on residuals computation
 _olsres = 1;

// Estimate model and store results in variables
 screen off;
 { nam, m, b, stb, vc, std, sig, cx, rsq, resid, dbw } = ols("", y, x);
 screen on;

print "Parameter Estimates:";
 print b';

/**************************************************************************************************/
 // Leverage
 H = x * inv(x'x) *x';

// Extract diagonal of of 'H'
 leverage = diag(H);

// Squared residuals
 sq_resid = resid.^2;

// Calculate standardized residuals
 norm_resid = resid / sqrt(resid'*resid);
 norm_sq_resid = norm_resid.^2;

/*
 ** Plot leverage vs. normalized square residual
 ** Declare plotControl structure
 */
 struct plotControl myLeveragePlot;

// Fill 'myLeveragePlot' with default scatter settings
 myLeverageplot = plotGetDefaults("scatter");

// Add axis labels to graph
 plotSetXLabel(&myLeveragePlot, "Normalized residual squared", "Arial", 14);
 plotSetYLabel(&myLeveragePlot, "Leverage");

/*
 ** Set axis range
 ** Y-axis Range
 */
 y_max = maxc(leverage);
 plotSetYRange(&myLeveragePlot, 0, y_max);

// X-Axis Range
 x_max = maxc(norm_sq_resid);
 plotSetXRange(&myLeveragePlot, 0, x_max);

// Create scatter plot
 plotScatter(myLeveragePlot, norm_sq_resid, leverage);

plotSetLineColor(&myLeverageplot, "black");
 plotSetLineSymbol(&myLeveragePlot, -1);

// Add average leverage line
 ave_leverage = reshape(meanc(leverage), 2, 1);

x_ave_leverage = 0|x_max;
 plotAddXY(myLeveragePlot, x_ave_leverage, ave_leverage);

// Add average normalize residual squared line
 ave_sq_resid = reshape(meanc(norm_sq_resid), 2, 1);

y_ave_sq_resid = 0|y_max;
 plotAddXY(myLeveragePlot, ave_sq_resid, y_ave_sq_resid);
 /*****************************************************************************/
 /*
 ** Internally standardized residuals
 ** Calculate MSE
 */
 mse = meanc(sq_resid);

// Root mse of regression
 s = sqrt(mse);

// Calculate standardized residual
 resid_standard = resid./sqrt(mse*(1 - leverage));

/*
 ** Plot leverage vs. normalized square residual
 ** Declare plotControl structure
 */
 struct plotControl myResidPlot1;

//Fill 'myResidPlot1' with default scatter settings
 myResidPlot1 = plotGetDefaults("scatter");

//Set plot labels
 //Add title to graph
 plotSetYLabel(&myResidPlot1, "Standardized Residuals", "Arial", 14);

//Create scatter plot
 plotScatter(myResidPlot1, x, resid_standard);
 /*****************************************************************************/
 /*
 ** Studentized residual
 ** T-k-1
 */
 denom_1 = num_obs - cols(x) - 1;
 denom_2 = denom_1*(1 - leverage);

// Root MSE with jth observation removed
 s_j = (mse*(num_obs-cols(x)))/denom_1 - sq_resid./denom_2;

// Studentized residual
 r_j_denom = s_j.*sqrt(1 - leverage);
 r_j = resid./r_j_denom;

/*
 ** Plot leverage vs. normalized square residual
 ** Declare plotControl structure
 */
 struct plotControl myResidPlot2;

// Fill 'myResidPlot2' with default scatter settings
 myResidPlot2 = plotGetDefaults("scatter");

/*
 ** Set plot labels
 ** Add title to graph
 */
 plotSetTitle(&myResidPlot2, "Studentized Residuals", "Arial", 14);
 plotSetXLabel(&myResidPlot2, "X");

// Create scatter plot
 plotOpenWindow();
 plotScatter(myResidPlot2, x, r_j);